

Demographics
OUR PEOPLE ARE THE REASON FOR PROSPERITY.
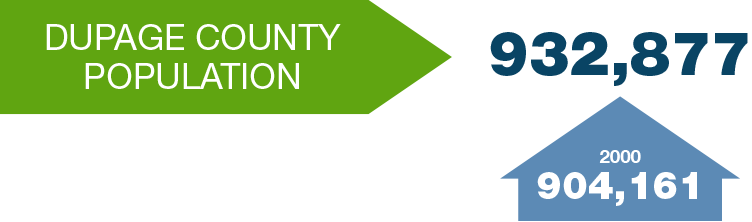
DUPAGE COUNTY POPULATION DEMOGRAPHICS
| NAME | 2020 | 2000 | DAYTIME POPULATION |
| ADDISON | 35,702 | 35,914 | 52,475 |
| AURORA* | 180,542 | 142,990 | 53,173 |
| BARTLETT* | 41,105 | 36,702 | 10,754 |
| BATAVIA* | 26,098 | 23,866 | 34,449 |
| BENSENVILLE* | 18,813 | 20,703 | 28,600 |
| BLOOMINGDALE | 22,382 | 21,675 | 27,866 |
| BOLINGBROOK* | 73,922 | 56,321 | 80,025 |
| BURR RIDGE* | 11,192 | 10,408 | 35,369 |
| CAROL STREAM | 39,854 | 40,438 | 43,128 |
| CLARENDON HILLS | 8,702 | 7,610 | 8,569 |
| DARIEN | 22,011 | 22,860 | 17,883 |
| DOWNERS GROVE | 50,247 | 48,724 | 75,694 |
| ELK GROVE VILLAGE* | 32,812 | 34,727 | 68,967 |
| ELMHURST | 45,786 | 42,762 | 59,865 |
| GLEN ELLYN | 28,846 | 26,999 | 37,619 |
| GLENDALE HEIGHTS | 33,176 | 31,765 | 29,515 |
| HANOVER PARK* | 37,470 | 38,278 | 8,787 |
| HINSDALE* | 17,395 | 17,349 | 27,270 |
| ITASCA | 9,543 | 8,302 | 27,698 |
| LEMONT* | 17,629 | 13,098 | 23,197 |
| LISLE | 24,223 | 21,182 | 36,960 |
| LOMBARD | 44,476 | 42,322 | 56,749 |
| NAPERVILLE* | 149,540 | 128,358 | 132,399 |
| OAK BROOK | 8,163 | 8,702 | 39,583 |
| OAKBROOK TERRACE | 2,134** | 2,300 | 40,817 |
| ROSELLE* | 22,897 | 32,115 | 16,709 |
| SCHAUMBURG* | 78,723 | 75,386 | 135,363 |
| ST. CHARLES* | 33,081 | 27,896 | 61,204 |
| VILLA PARK | 22,263 | 22,075 | 40,817 |
| WARRENVILLE | 13,553 | 13,363 | 18,120 |
| WAYNE | 2,424** | 1,089 | 895 |
| WEST CHICAGO | 25,614 | 23,469 | 36,133 |
| WESTMONT | 24,429 | 24,554 | 27,255 |
| WHEATON | 53,970 | 55,416 | 53,490 |
| WILLOWBROOK | 9,236 | 8,967 | 31,654 |
| WINFIELD | 9,835 | 8,718 | 11,647 |
| WOOD DALE | 14,012 | 13,535 | 19,584 |
| WOODRIDGE* | 34,158 | 30,934 | 34,212 |
| * Municipality is located in multiple counties. ** Based on 2021 Estimates |
DUPAGE COUNTY POPULATION / DEMOGRAPHIC CHARACTERISTICS
| POPULATION BY AGE | |
| TOTAL | 932,877 |
| UNDER 18 YEARS | 209,897 |
| 18 YEARS + | 722,980 |
| 65 YEARS + | 150,193 |
| MEDIAN AGE | 39.1 |
| POPULATION BY SEX | |
| MALE | 458,976 |
| FEMALE | 473,901 |
| POPULATION BY RACE (PERCENTAGE) | |
| WHITE | 79.5% |
| BLACK OR AFRICAN AMERICAN | 5.3% |
| ASIAN | 12.7% |
| NATIVE HAWAIIAN AND OTHER PACIFIC ISLANDER | 0.1% |
| HISPANIC OR LATINO (OF ANY RACE) | 14.6% |
| TWO OR MORE RACES | 2.1% |
| HOUSING/HOUSEHOLD CHARACTERISTICS | |
| TOTAL HOUSING UNITS | 362,182 |
| OWNER-OCCUPIED HOUSING UNITS | 73.4% |
| MEDIAN VALUE OF OWNER OCCUPIED HOUSING UNITS | $308,500 |
| MEDIAN HOUSEHOLD INCOME | $92,809 |
| Source: US Census Bureau, 2021 Estimates |